Clojure - Reading CSV files
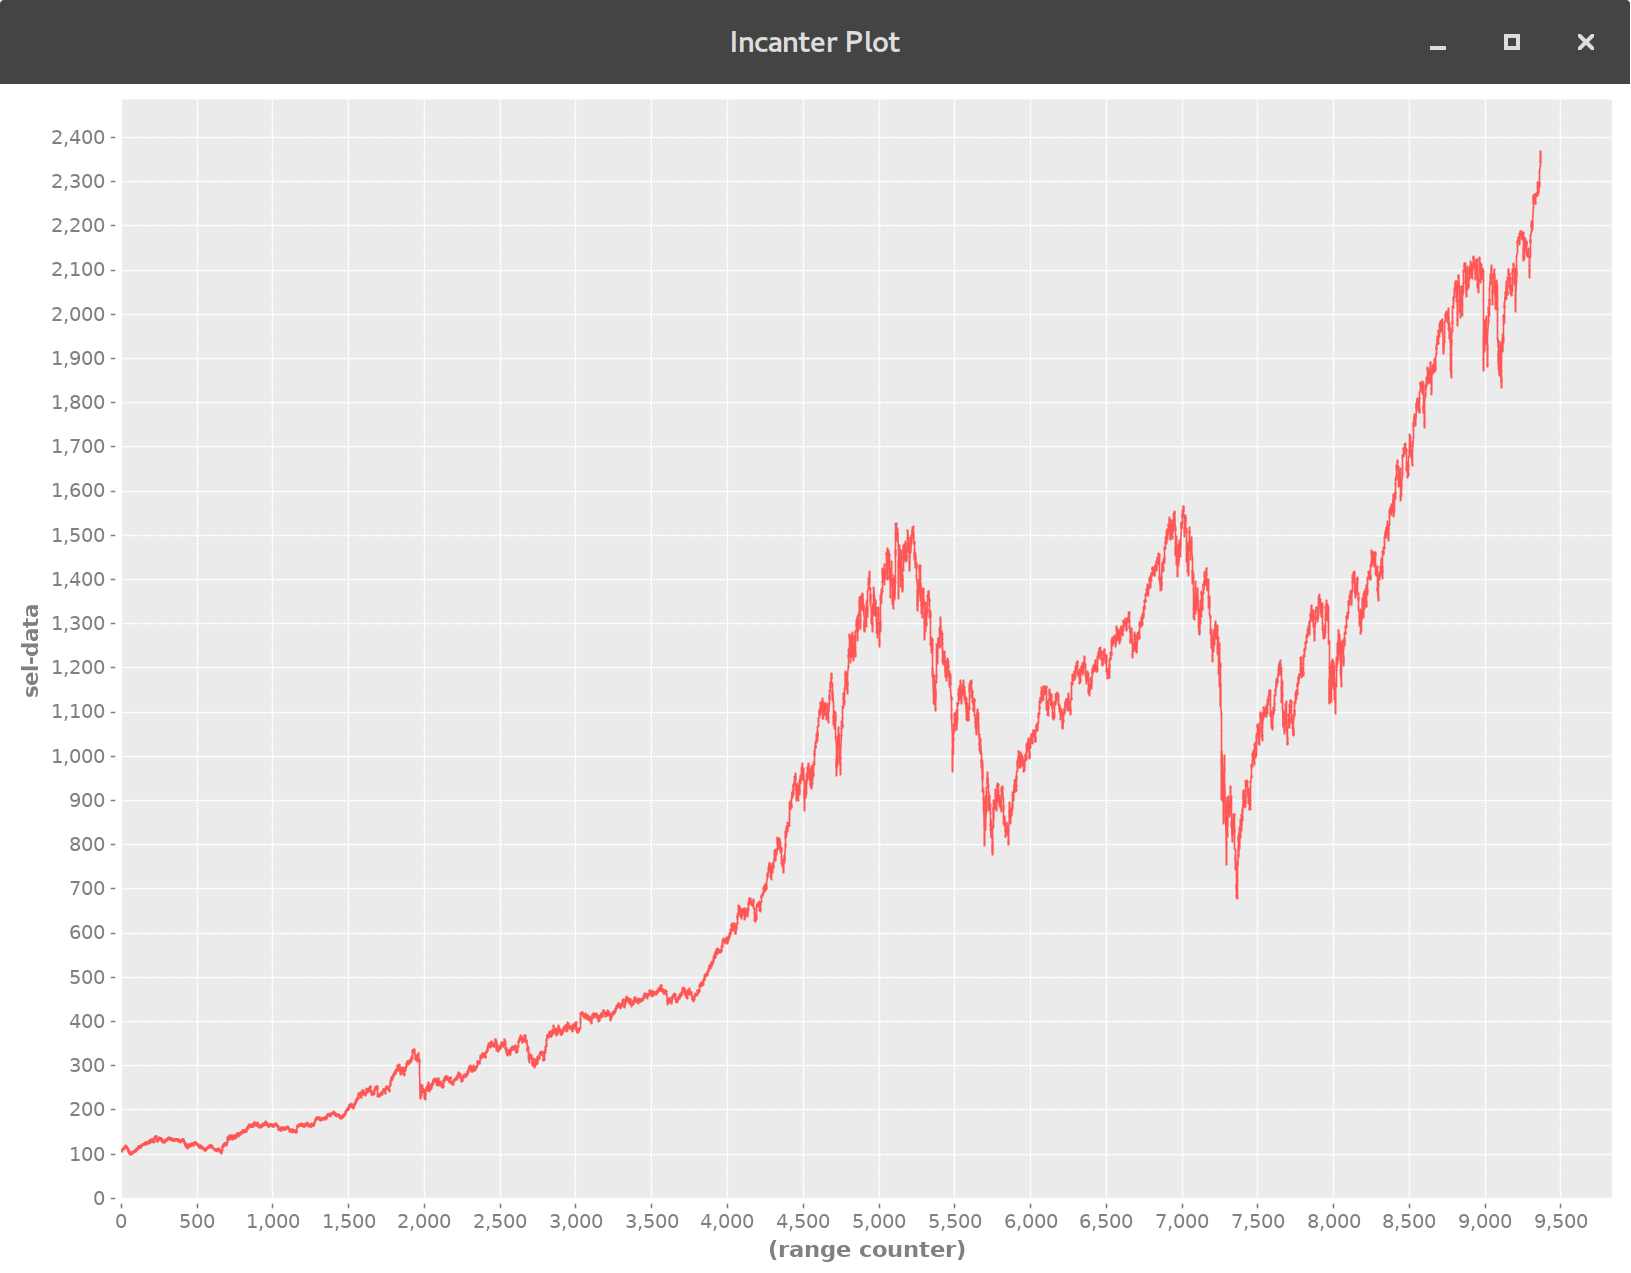
Lets have some fun today and analyze some data! Let us look at the S&P500 which is a index commonly used to see how well the stock market is doing.
We can get the data for the S&P500 from yahoo finances link to that below. Make sure you have the range from Jan 03, 1980 to recent.
Link to the S&P500 Data from Yahoo Finances
Let us go ahead and run a lein project by the following command you can skip this if you already have a project and you can just add incanter to the dependencies.
$ lein new incantertut
After you have downloaded the cvs file go ahead and rename it to
Let us set up our project.clj file to be this so that we have incanter in our project so that we can read csv data and as well as display the data if we decide to do that.
(defproject incantertut "0.1.0-SNAPSHOT"
  :description "FIXME: write description"
  :url "http://example.com/FIXME"
  :license {:name "Eclipse Public License"
            :url "http://www.eclipse.org/legal/epl-v10.html"}
  :dependencies [[org.clojure/clojure "1.8.0"]
                 [incanter "1.5.5"]])
Now we can move on to the good part and start in our core.clj that in our src directory when creating a lein project.
Go ahead and include the following for the namespaces. If you haven't seen incanter charts yet I recommend going through some of the previous guides I wrote on how to make graphs with incanter but otherwise I'll re-explain it briefly here as well.
Making Graphs With Incanter
(ns incantertut.core
  (:use [incanter.charts :only [histogram scatter-plot pie-chart add-points add-lines xy-plot]]
        [incanter.core :only [view]]
        [incanter.stats :only [sample-normal linear-model]]
        [incanter.io :only [read-dataset]])
  (:require [clj-time.core :as tc]
            [clj-time.periodic :as tp]
            [clj-time.coerce :as tco]))
Now to the good stuff. Add the following underneath the namespace in your core.clj file.
(def data (read-dataset "data.csv" :header true))
(:rows data)
(map :Open (:rows data))
(defn view-data [selection data]
  (let [sel-data (reverse (map selection (:rows data)))
        counter (count sel-data)]
    (view (xy-plot (range counter) sel-data))))

(view-data :Open data)
That is about it you can fix it up a bit by using a time-series instead so that instead of numbers on the bottom you have dates. As well as overlapping it with close prices too. Prehaps in another blog post.