Python - Bokeh to Graph Boot Times
So I been playing around with Bokeh's graphing utilities which is always fun. So I wanted to make some graphs using the boot times that I keep using a script. So I made three different graphs 2 of which represent the total boot time and the other pie graph represents the total boot time into segments of firmware, loader, kernel and userspace.
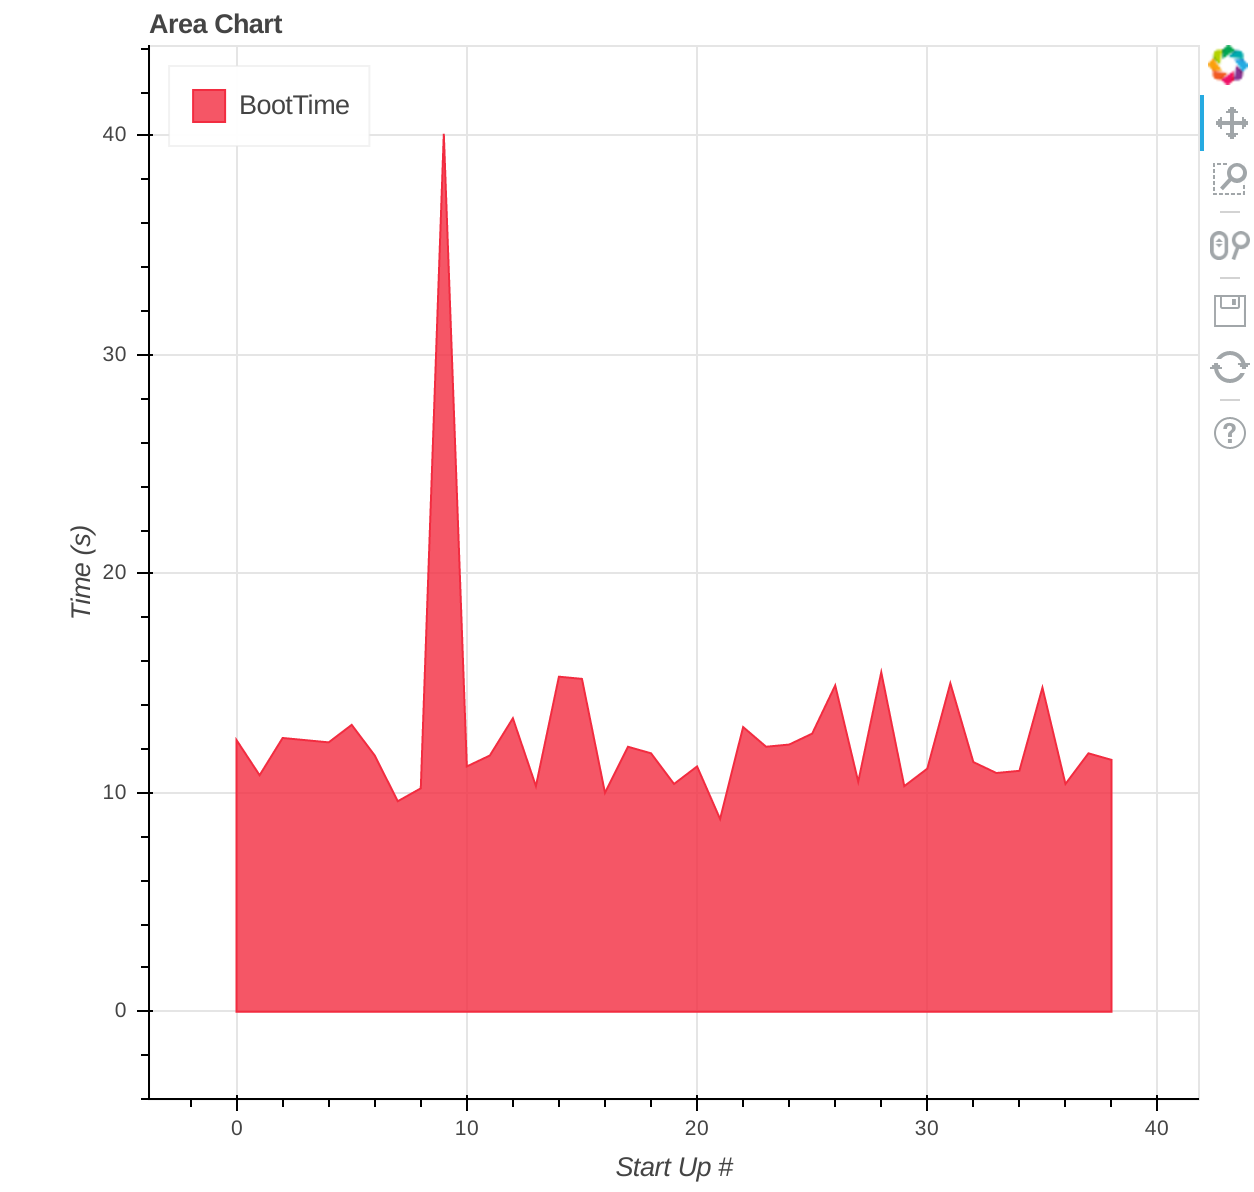
The one above demonstrates the total time as an area under the line. You can clearly see here that there was a spike in the boot time since that 40 second boot time is distinguishable from the other plots are around 12 seconds.

This one is a pie graph I couldn't figure out how to label them but it just demonstrates each part of the boot as a pie graph (Firmware, Loader, Kernel, Userspace).
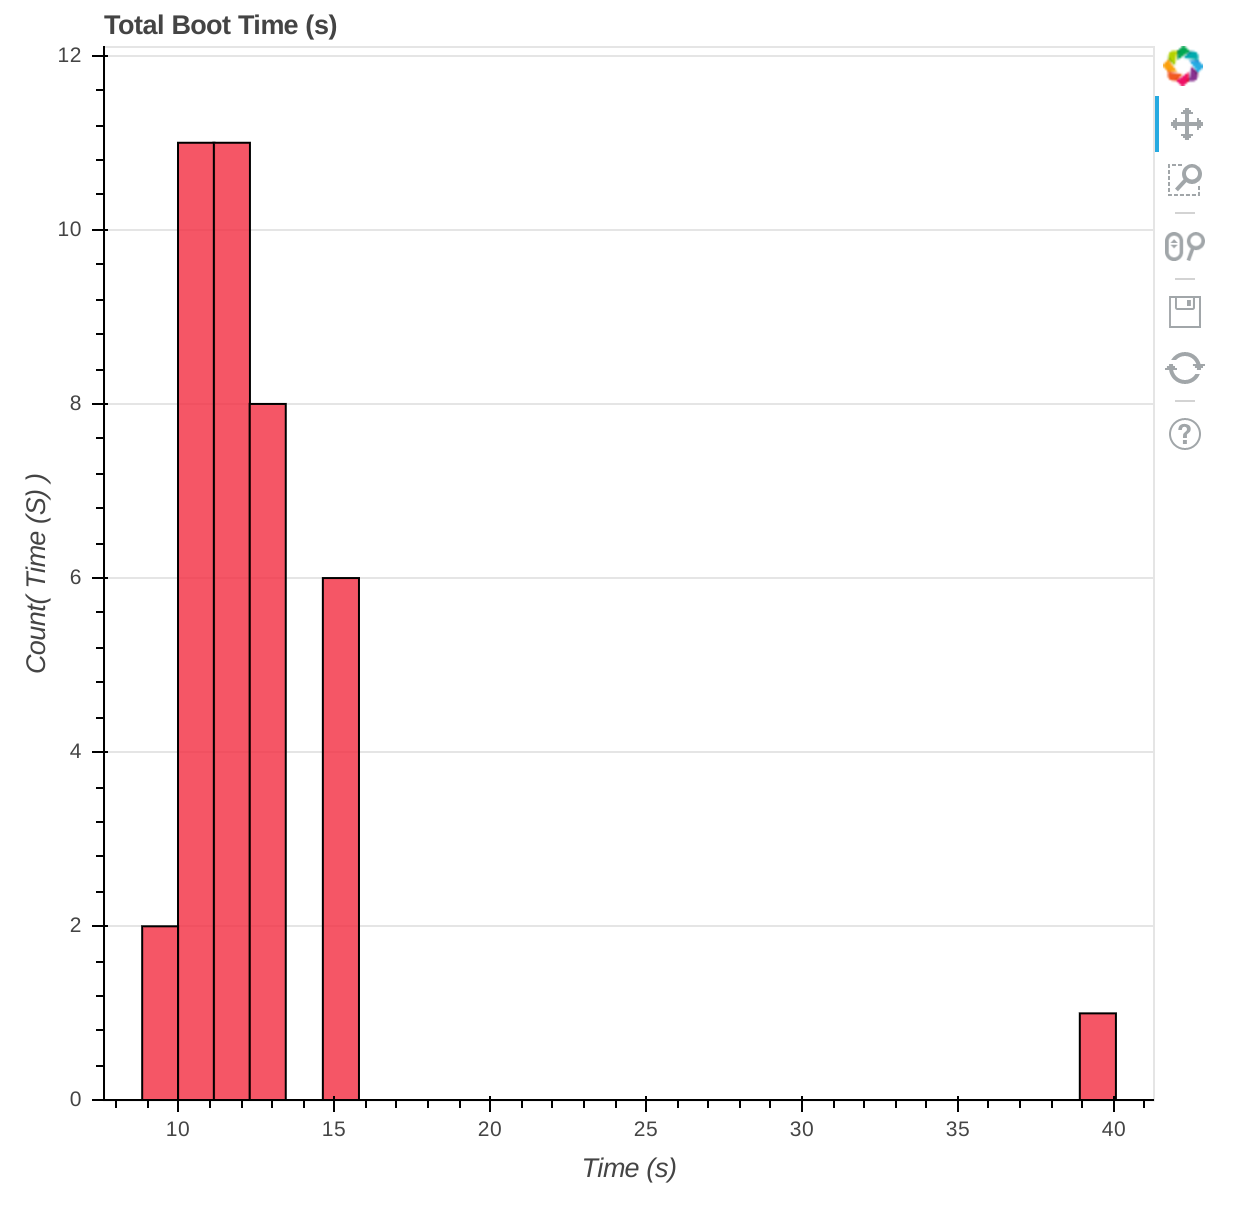
There is also a histogram showing the usual time it takes to boot up which you can see from this graph is around 12 seconds since that is the most frequent time it takes to boot up.
The data is collected from
systemd-analyze time >> time.txt