Python - SpaceTime Diagrams
So I been playing around with numpy and matplotlib in python lately. Wonderful tools for numerical analysis and data ploting. So I played around with them and decided to use them to construct a script in order to generate spacetime graphs. For those that don't know what a space time graph or diagram is essentially a way to visualize an object moving or not moving through space and time. Looks something like that on the bottom.
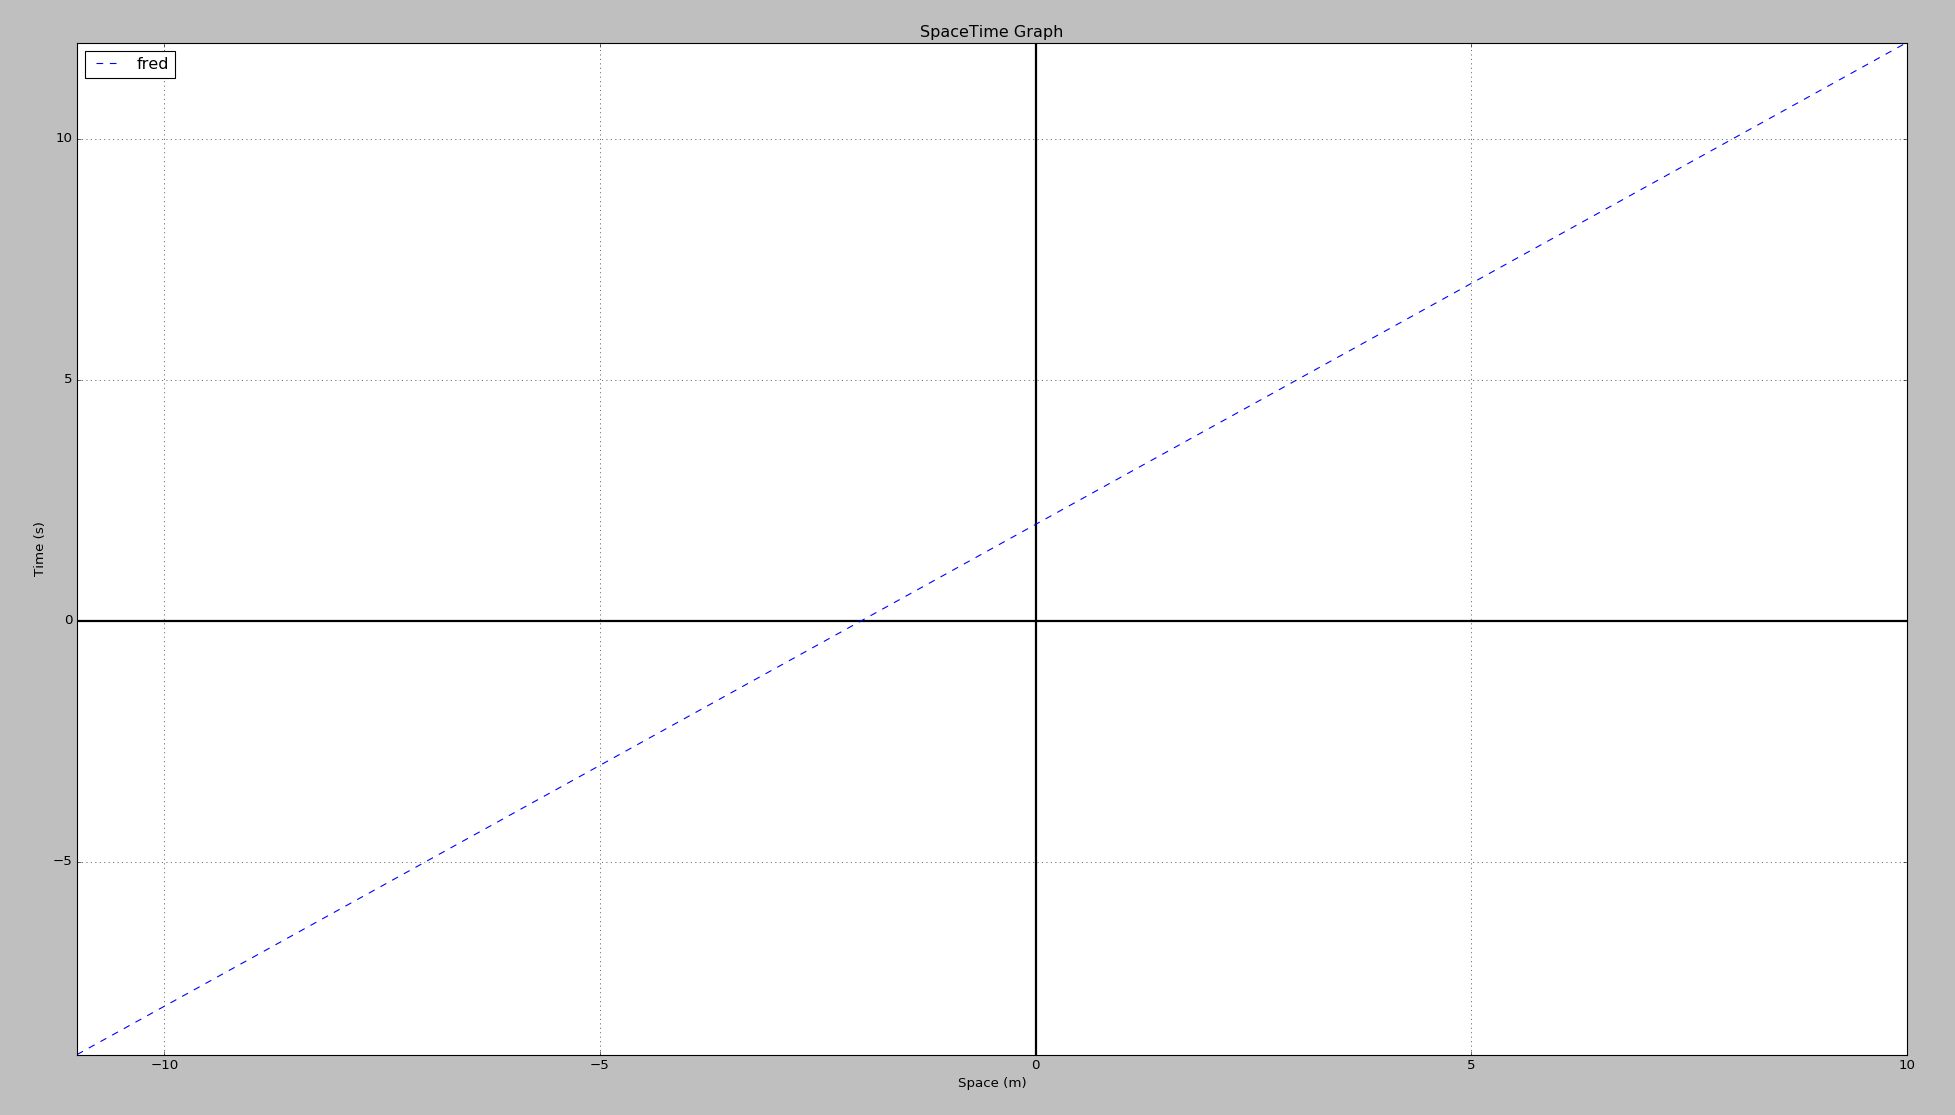
One of the things you'll instantly maybe find alarming about spacetime diagrams is that time is on the y axis. I know I was since usually time is normally placed on the x axis. Placing time on the y axis as I been told is somewhat traditional not really done on purpose but thats the way spacetime diagrams should be done.
So since time is on the y axis this means a few things our y intercept, b is going to be a value with units of time usually seconds. However in spacetime diagrams you can essentially make the units whatever you want as long as they make sense so if you wanted you could make the units of time as meters using the speed of light constant c. So whatever the distance that light will cover in 1 second you can convert to that for meters and use that as a value of time since it is equivilant. Of course that might sound a bit wierd and probably I didn't explain that too well but your x axis is a measure of space. Space can be measured in meters. So now you have the same units for both x and y axis.
Now remember that time is onthe y axis so this brings about some consequences such as the slope of the line becomes 1 over the speed of the object. So we can write an equation for this line in the following way as t = (1/v)*x + b.
The t stands for the time (m), the v in this case is the velocity which is in units of c, the x is the position of the object (m), and the y intercept is b which remember would originally be seconds but we converted time to meters using the speed of light constant so b is in terms of meters.
In order to generate the script you need the SpecialRel.py and SpaceTimeGraph.py.
You can get those scripts by just cloning the entire repo or just downloading them individually.
Usage
The way you use the script is the following.
$ python SpaceTimeGraph.py -v 0.2 -b 2
There are other options that you can specify and to see all of them type the following.
$ python SpaceTimeGraph.py -h
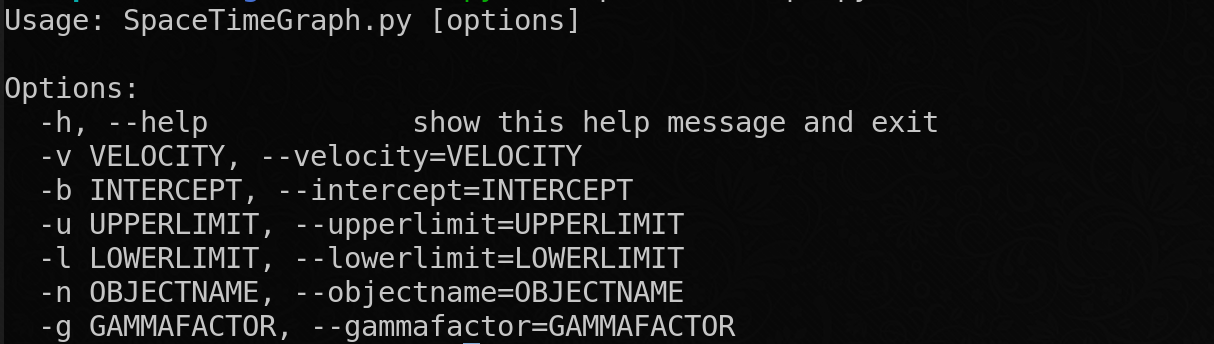
You can change the upper and lower limits of the graph and determine how far you want the graph to extend out to using the options